3 Exploring and Communicating with Data

3.1 The Data Science Cycle
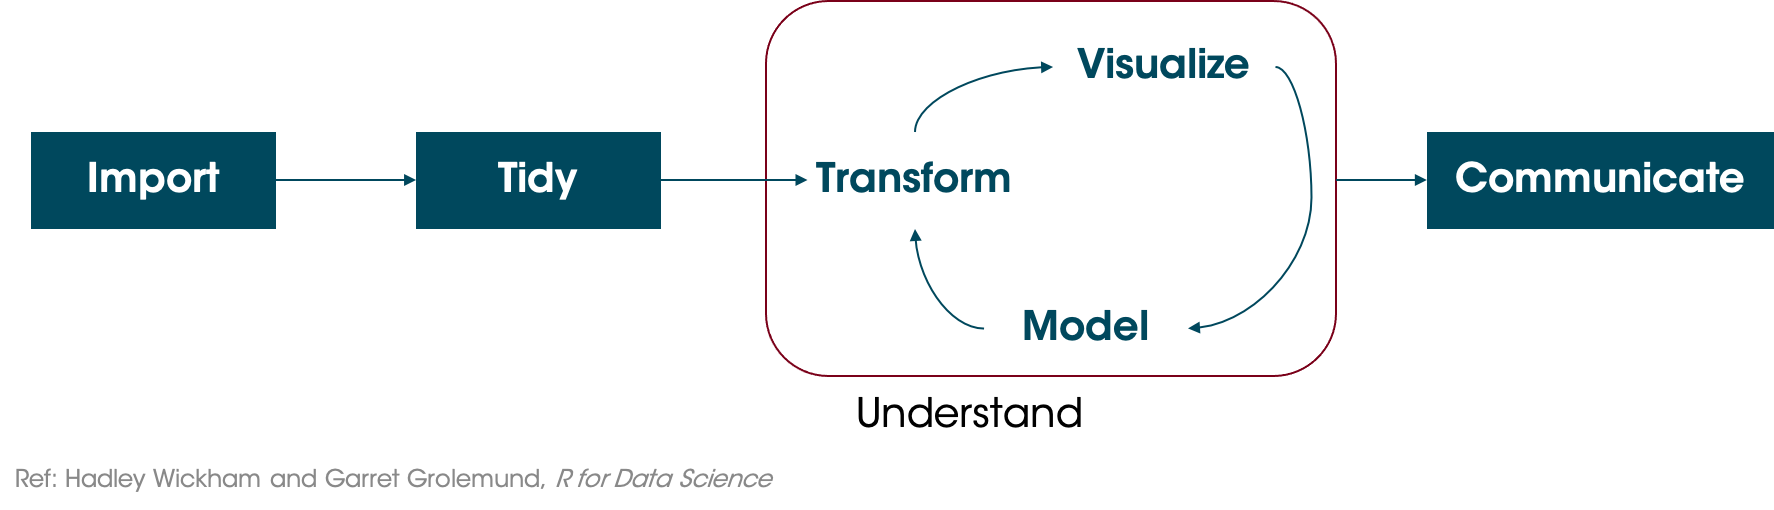
Wickham and Grolemund propose the Data Science Cycle as one way to organize your process. After importing your data and tidying it (cleaning and arranging it for analysis), you explore and gain understanding. Finally, you communicate your results.
3.2 Exploratory vs. Explanatory Data Analysis
In Exploratory Data Analysis (EDA), you don’t necessarily know what you’re looking for. You might have an idea that there’s a problem or heterogeneity (something different). Exploratory data analysis takes place in the iterative loop in the Data Science Cycle above.
EDA is not formal, rigid or defined. Start with questions about your data, and then look at them. Use a combination of transformations (e.g. looking at the mean or median), visualizations (e.g. bar charts, histograms, etc), and models (e.g. linear regression).
You will often have some initial questions and hypotheses to go on, like “Are sales different in different regions?” or “Do donors give more on Mondays?” or “Do students perform better if they eat a snack?”
"[Exploratory Data Analysis] is a state of mind. During the initial phases of EDA you should feel free to investigate every idea that occurs to you. Some of these ideas will pan out, and some will be dead ends. (Hadley Wickham and Garrett Grolemund, R for Data Science, pg 81)
Dashboards are often an important tool to help non-data people who are domain experts (e.g. doctors, sales managers) perform their own EDA.
After exploratory data analysis, you will often move to the last step of the Data Science Cycle, communicating. This is where explanatory analysis, comes in.
“[Explanatory analysis is when] you have something specific you want to communicate to somebody specific” (Cole Nussbaumer Knaflic, Storytelling with Data Talk at Google)
Rather than letting people get lost in the data or just presenting a big table, we want to say something very specific using the data.
3.3 Storytelling with Data
3.3.1 Step 1: Focus Attention
Cole Nussbaumer Knaflic, author of Storytelling with Data, argues that there are two keys to effectively communicating with data. First, is to focus attention using pre-attentive attributes and effective design. Rather than just putting all the information on the page, draw attention to specific parts strategically to cue your readers.
Thinking about our hotel booking data, suppose we want to compare the average daily rate across marget segments. Below, see two graphs.
### Create a figure with two bar charts
# Load packages. gridExtra package arranges multiple plots in a figure
library(tidyverse)
library(gridExtra)

# Load booking data
booking_data <- read_csv("hotel_bookings.csv")

# Create two plots with our booking data
topplot <- booking_data %>%
  group_by(market_segment) %>%
  summarize(adr = mean(adr)) %>%
  ggplot(aes(x = market_segment, y = adr)) +
  geom_bar(stat = "summary", fun = "identity") +
  labs(x="Market Segment",
             y = "Avg Daily Rate ($)")

bottomplot <- booking_data %>%
  group_by(market_segment) %>%
  summarize(adr = mean(adr)) %>%
  ggplot(aes(x = reorder(market_segment, -adr), y = adr, fill = market_segment)) +
  geom_bar(stat = "summary", fun = "identity") +
  scale_fill_manual(values=c("grey50", "grey50", "grey50", "#7a0019", "grey50", "grey50", "grey50", "grey50")) +
  labs(x="Market Segment",
       y = "Avg Daily Rate ($)") +
  theme(legend.position = "none",  # Hide legend
        panel.background=element_blank(),
        panel.grid.minor=element_blank(),
        panel.grid.major.y=element_blank(),
        panel.grid.major.x=element_line())

# Display the plots side by side with a shared title
grid.arrange(topplot, bottomplot, ncol=1,
             top="Hotel Bookings - Avg Daily Rate by Segment")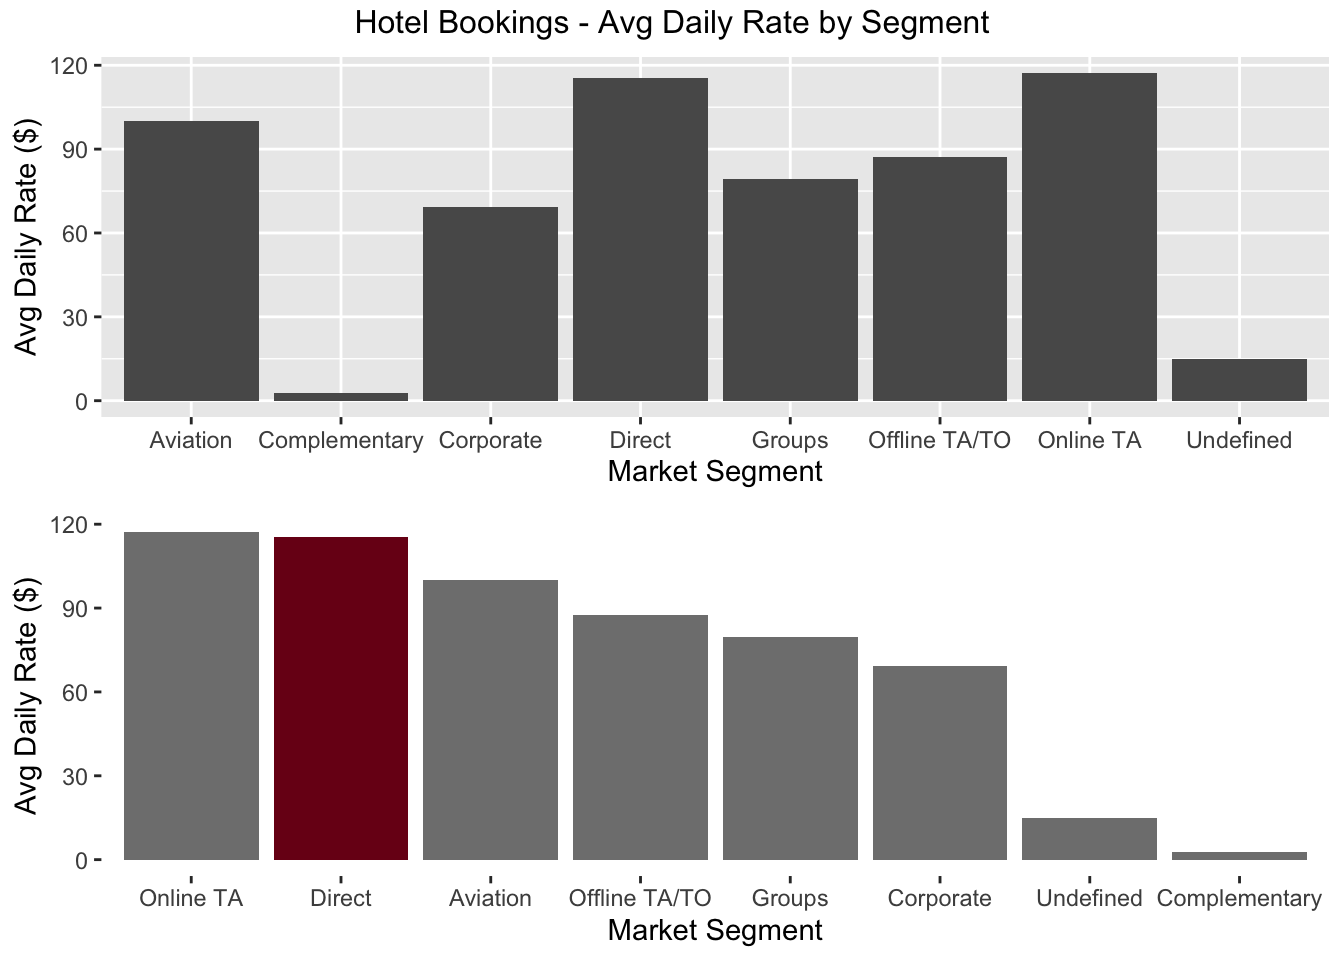
(#fig:Segment ADR Bar Chart)Bar Charts showing Average Daily Rate by Market Segment
They’re very similar. The top graph isn’t bad, but the bottom one cues us in immediately to look at the Direct Sales Market Segment. Even though I haven’t told you anything more, you’re already focused on Direct Sales. Maybe you even started comparing it to the others. In the top one, maybe your brain started comparing Aviation to Complementary, and Corporate to Groups. But with the bottom one, I bet the primary comparisons were X vs Direct. We’ll talk more about preattentive attributes in the next section, but this is an example of using color.
3.3.2 Step 2: Tell a Story
We’re going to focus attention, but on what and for what purpose? To tell a story. Humans love stories…we have told each other stories and passed them down for centuries! As we think about crafting the story and incorporating our data, there are a few things to keep in mind.
3.3.2.1 Audience: Who/What/How
Who the audience is will drive everything in your presentation. Are you presenting to salespeople technical engineers? Are you presenting to management (internal) or customers (external)? Consider also who you are. Are you an expert or are you new? If you’re an external consultant, you are going to need to back up your statements with data.
What do you want your audience to know? This connects with the Bottom Line Up Front (BLUF) and the Elevator Pitch below. It should be clear!
How are you going to convince your audience? What data will you show them?
Turning to our hotel_bookings.csv data again, suppose we are evaluating where to spend money. You will present your findings to the hotel management.
Who: Hotel management that can approve where we spend/allocate marketing dollars
What: Direct bookings generate a higher Average Daily Rate than any other sector, so we should reallocate marketing dollars to support Direct Bookings
How: Showing Figure ?? with the average daily rate (ADR) generated by different marketing segments, showing that Direct bookings generate higher revenues.
3.3.2.2 Bottom Line Up Front (BLUF)
The Bottom Line Up Front or BLUF is the takeaway. Consider giving this to your audience right at the outset…“Here’s what I’m going to tell you.” Sometimes it’s good to leave your audience in suspense, wondering what’s going to happen. Oftentimes, not. The BLUF is a complete sentence that takes a position
✅ Good BLUF: The Direct Channel yields one of the highest Average Daily Rates (more than most other booking channels) but receives no marketing support; to increase the bookings with High ADR, allocate more spending to Google Search ads.
❌ Bad BLUF: Different channels have different rates. (This is general, somewhat descriptive, and doesn’t imply action.)
3.3.2.3 Elevator Pitch (“3 Minute Story”)
It’s a useful exercise to be able to tell the complete story in 3 minutes. This ensures that it’s clear to you. It means conveying the whole story, from top to bottom, in just 3 minutes. Start with the problem/objective, how we might address it, results of the analysis, and what can be done about it.